How to Actually Make a Gantt Chart ?+ Best Tips

As a product manager, you quickly learn that you have to balance many things, such as strategy, implementation, and communication.
How do you juggle these three tasks with ease? Here’s where Gantt charts are useful.
You can think of Gantt charts as visual road maps that will help you reach your goals. These bar graphs may look basic at first, but they can change the way you handle projects.
They put together all the information about a project, like tasks, dates, and team members’ jobs, into one picture that is easy to reach and follow.
A Gantt chart shows you and the people who have a stake in the project at a glance how things are going and what the status is.
It also makes sure that everyone knows what their duties are and when they need to be done. This can then lead to better responsibility and better control of tasks and resources.
If you’ve come here to learn how to make a Gantt chart, this is the right place. We’re here to help you get the most out of it.
No matter how much experience you have as a project manager or how new you are to the field, here’s a detailed overview. Let’s begin.
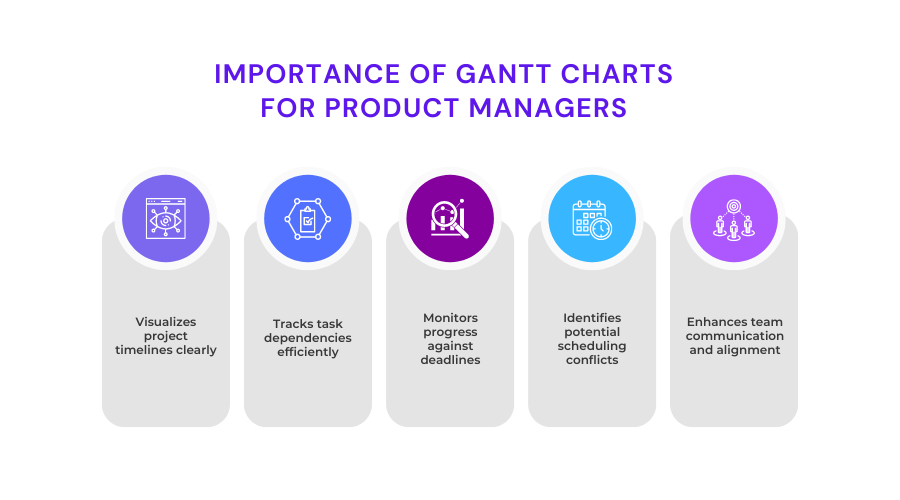
Key Takeaways
- Gantt charts are visual roadmaps that help project managers balance strategy, implementation, and communication.
- They provide a clear picture of project progress, including tasks, dates, and team members’ jobs.
- Gantt charts ensure everyone knows their duties and when they need to be done, leading to better responsibility and control of tasks and resources.
- Gantt charts can be categorized under Roadmap Tools, such as Jira, which have elements like a flexible task structure and resource management screens.
- The structure of a Gantt chart can be optimized for viewing and arranging project schedules.
- Key elements of a Gantt chart include Date & Time, Bar Graphs (Task Bar), Milestones, Critical Path, Vertical Line Markers, and Resources.
- Understanding these elements can help teams view and arrange their project schedules effectively.
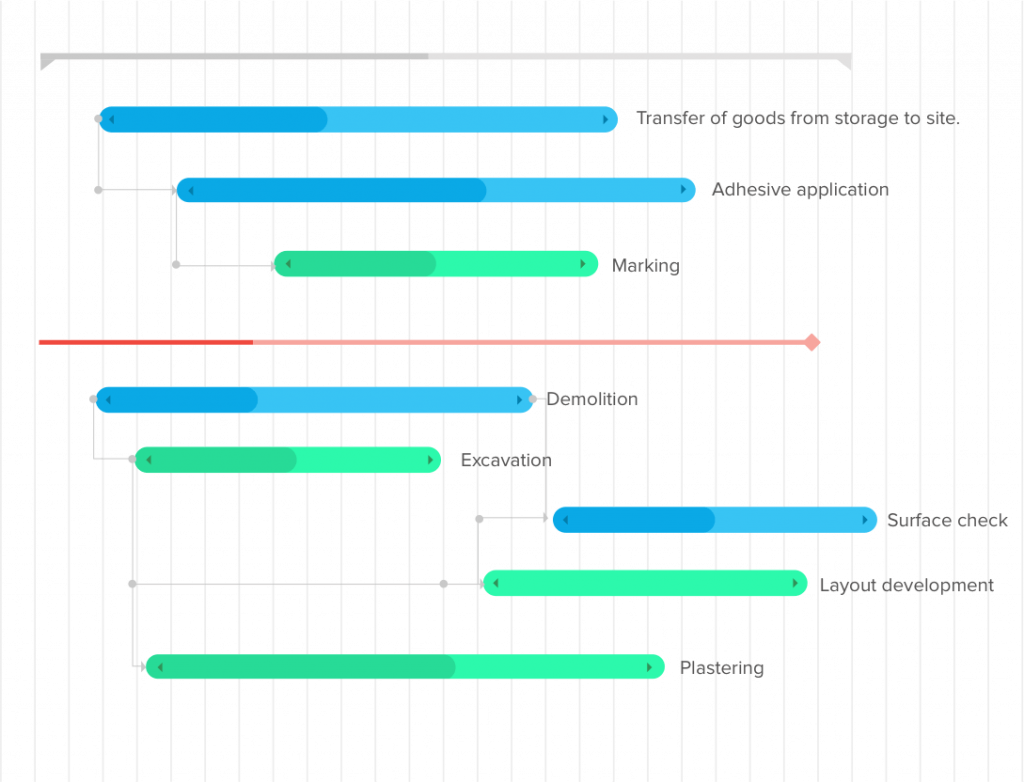
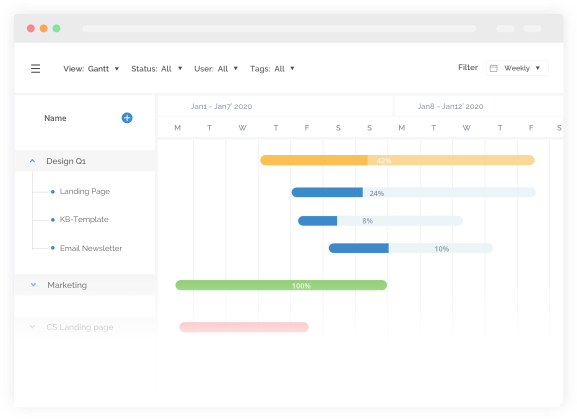
What Makes Up a Gantt Chart?
A Gantt chart, in simple terms, shows the progress of a project against the projected time. The left side usually has an array of tasks, and the right side has a plan with bar graphs that show how work will be done.
The Gantt chart can also show the due dates and goals for tasks, as well as the relationships between tasks and the people who are responsible for them.
You can categorize Gantt chats under Roadmap Tools. Roadmap tools like Jira have elements like a flexible task structure and resource management screens.
This helps teams stick to a clear project plan. Timelines and Plans are two roadmap tools in Jira that you can use to make a Gantt chart for your projects.
Curious about what makes up a Gantt chart and how every element supports good project management?
Knowing the structure of a Gantt chart will enable you to maximize its ability for viewing and arranging your project schedules.
The Gantt chart requirements of different teams will show different themes based on workflow and deadlines. Here are some of the main elements you should include:
Date & Time:
Gantt charts display activity timeframes from start to conclusion as well as their arrangement on the general project timetable to promote simpler planning.
Bar Graphs (Task Bar):
Bar graphs show assignments in order of importance for completion. Tasks are arranged vertically on the left.
You can project each task as a graphic indicator on a timeline. This helps one see task dependencies across the lifecycle of a project very clearly.
Milestones:
On a Gantt chart, key stages of a project are shown as milestones—that is, activities with a clear marker.
When showing the success rate of a running assignment, you can monitor progress with respect to how close every stage is to its associated milestone.
Critical Path:
The assignments in your project that take the most time are on the critical path. The critical path helps you see all the tasks that you need to prioritize in order to close it on time.
Once they are found, the project manager will have a very good idea of how long the whole project will actually take to finish.
Vertical Line Markers:
This provides the present details of a project on the chart, thereby guiding your view of project placement and the remaining work load.
Resources:
Certain projects will call for equipment, paperwork, or connections that will help one finish a project. Here’s where the Resources tab will come to your rescue and help you allocate these factors.
How Can You Make a Gantt Chart?
Making a Gantt Chart is not as difficult as you think it is. All you need to do is decide what you want to do with it first.
Here’s a common structure for creating a Gantt chart:
- Step 1: Create an Overview
- Step 2: List down all Tasks and Activities
- Step 3: Set a Timeline
- Step 4: Create Dependencies
- Step 5: Assign Tasks
- Step 6: Track Milestones
1. Create an Overview
Understanding the project scope is crucial before producing a Gantt chart. Project scope includes objectives, tools, and outputs. It gives everyone a clear goal.
This crucial phase sets expectations and helps everyone get on the same page for your project.
A lengthy discussion with stakeholders is important to clarify the project scope. Every objective should be quantifiable and feasible.
Project success may depend on capital, schedule, and resource constraints, so do consider them while creating a Gantt chart.
You can create a Gantt chart that drives your project by carefully defining the project scope.
2. List Down All Tasks and Activities
Now, list down all the tasks you need to do to finish your assignment. In this step, you’ll divide the project into separate tasks.
This might include meetings, analysis, layout, and more. It’s easy to plan, prepare, and divide up resources this way.
Write down everything that you need your time to do and when they need to do it. You can manage the task list even better by dividing the things into main tasks and smaller tasks that are part of the main task.
Add as many details as you can so you miss nothing. Write down the time, skills, and tools that are needed for each task.
3. Set a Timeline
Define a start and finish date for every project activity. You can show these timelines using horizontal bars.
This makes sure you can visualize the scope of your project easily. Keeping everyone in line on deadlines and significant benchmarks offers a reasonable projection of how many days, weeks, or months a task requires.
As you plan out your schedule, consider elements such as the intricacy of the work, the tools at hand, and any obstacles.
While being more detailed with assignments, you can devote more time to bigger projects. When your project has a solely restrictive deadline, start with the endpoint and work backwards to create the schedule.
Keep some room in your schedule to let any unanticipated delays or adjustments fit.
4. Create Dependencies
Recognizing task dependencies—that is, the link between activities inside a project—is absolutely vital.
In some cases, you need to complete Task B first before you can begin with Task A. On the other hand, sometimes you can also begin with Taks B autonomously.
Your Gantt chart must show these dependencies if it is to fairly depict your project schedule.
Examine your task list to find which ones rely on others for execution. Mark these dependencies, then use joining arrows or lines to link them.
Finding task dependencies in your Gantt chart can help you improve your Gantt chart and maintain your flow.
5. Assign Tasks
Now, you’re ready to assign jobs to suitable team members using the project schedule. You should lay out assignments suitable for the person or group with the most suitable workload, abilities, and experience.
It is also equally crucial to distribute the work evenly. This is to prevent overloading team members while underusing others.
After you allot tasks on your Gantt chart, you should be able to see exactly who is working on what and when in reference to your project schedule.
Keep observing projects, as shifts in assignment criteria and team member availability could call for revisions all through the process.
6. Track Milestones
Milestones are important occasions or successes that act as benchmarks for assessing the development of your project.
These could mark the conclusion of a key period, a significant turning point, or a means of achieving a certain aim.
Mark them on your Gantt chart at suitable places in the timeframe. Set them apart from standard task bars with unique symbols like diamonds.
You can give a quick overview to help clarify and set the context for its importance to the project.

What Tools Can Help You With Gantt Charts?
We’ve covered great details about Gantt Charts. It’s now time to look into what can help you create them. Here are 5 best tools uncovered to help you make a Gantt chart.
1. Chisel
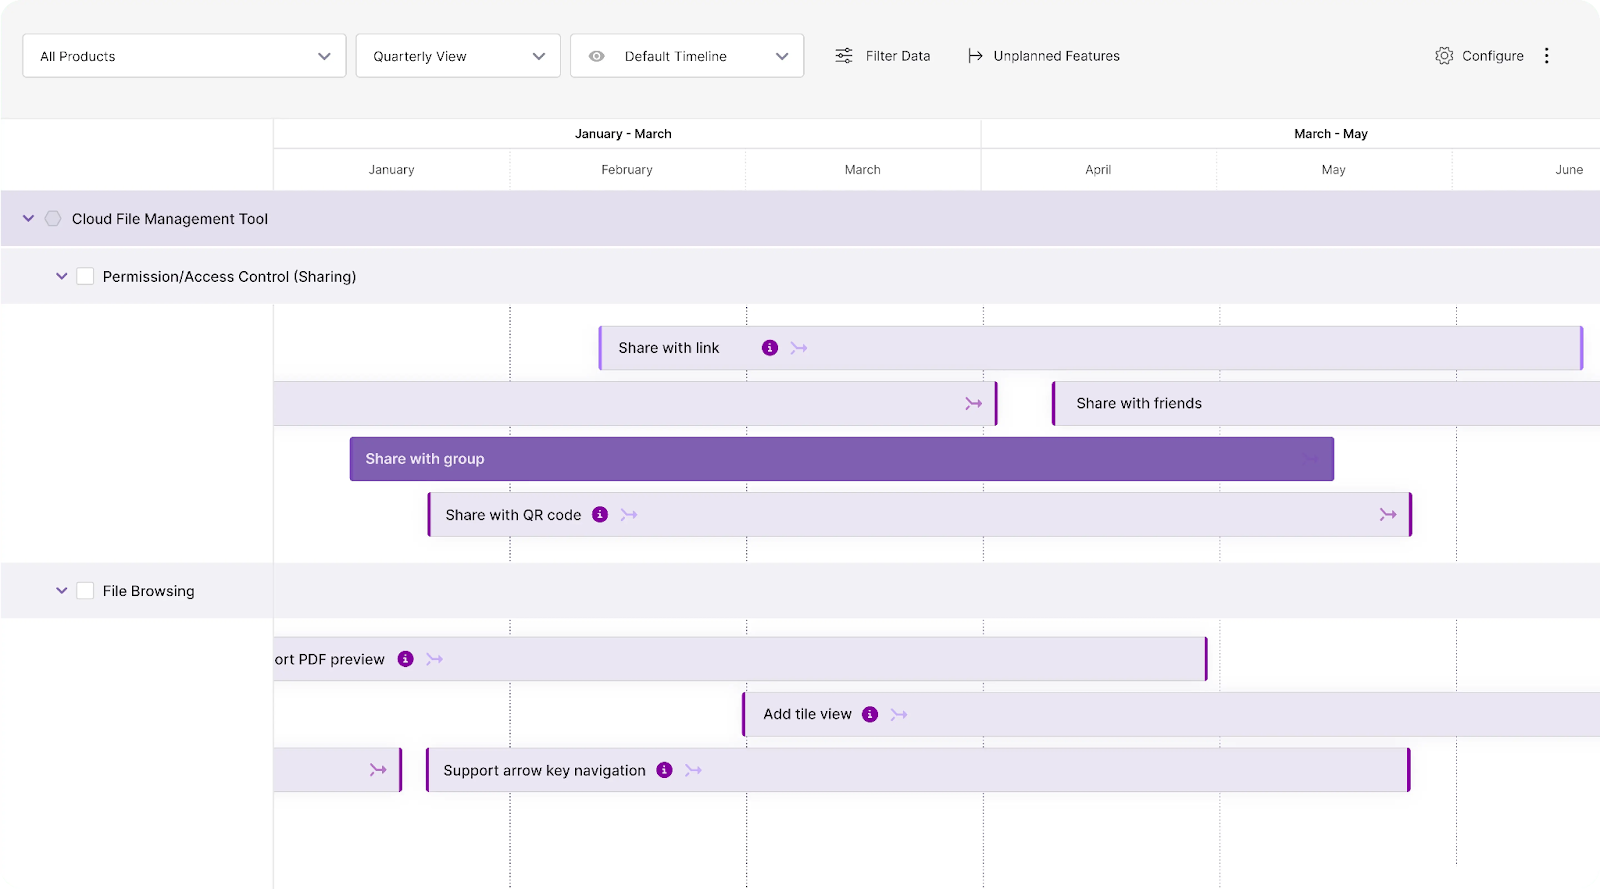
Chisel is great software for making and handling Gantt charts. It is simple and straightforward to use; hence, it is at the top of our list.
The software has many benefits, such as being affordable and simple to use. This helps product teams that need to work together to decide what to do first.
How Can Chisel Help You?
- Chisel has a timeline view that lets you see all of your assignments at once. It shows objectives as a Gantt chart that you can change.
- This gives you a bird’s-eye view of dependencies and makes sure everything gets done on time. Adding dates to features makes it easy to see how things are progressing.
- The timeline view shows all of your paths at once, so you can see exactly where your projects and parts are at all times. It helps product managers get work done throughout teams and spot risks early on if something starts to slip.
- Chisel’s Milestone feature lets you clearly map out short-term goals with deadlines.
- You can merge the milestone feature straight into Chisel timelines. This helps see the whole picture, spot problems right away, and make sure that work fits in with the general launch goals and product plan.
Rating:
4.9 / 5
Pricing:
- Freemium
- Premium: 49$ per maker per month
- Enterprise: Contact Sales
2. Wrike
Wrike is a project management tool that provides Gantt charts as an in-built feature. It brings together all of a team’s assignemtns and members into one environment.
This removes confusion, boosts productivity, and lets each person focus on the work that matters the most to them.
How Can Wrike Help You?
- Wrike allows you to quickly generate and change Gantt charts to monitor the development of your initiative.
- Given its free option, you have more choices, so take Wrike into consideration if cost is a major issue.
- Wrike’s free project management tool includes:
- Task and subtask management
- Unlimited users
- Internal and external collaborators feature.
- It also interfaces with many other well-known applications, including Google Drive, JIRA, and Dropbox.
Rating:
4.2 / 5
Pricing:
- Free
- Team – $9.80 user/ month
- Business – $24.80 user/ month
- Enterprise – Contact Sales
- Pinnacle – Contact Sales
3. Proofhub
You can use Proofhub to develop assignments, work together with customers and teams, and understand the status by looking at everything in a Gantt chart.
How Can Proofhub Help You?
- You can easily add tasks by clicking the “Add” icon at the top of the screen. Similarly, to set requirements, drag and drop tasks from one end to the other as needed for your project.
- Additionally, you can set a benchmark to compare real timelines to predicted ones. This helps you figure out if there might be gaps in the strategic planning.
- Proofhub also has a chat function that makes it easy to talk to each other and work together.
- Everything is always safe and saved up because the software is in the cloud. Also, you don’t have to set up any applications on your desktop.
Rating:
4.5 / 5
Pricing:
- Small Team (10 Users) – $79 per month
- Large Team (100 Users) – $139 per month
- Large Team Plus – $279 per month
4. Zoho Projects
Zoho Projects is all-in-one program for managing projects, and it has powerful Gantt chart features.
How Can Zoho Projects Help You?
- You can create Gantt charts in Zoho Projects to observe your project’s progress. These charts show goals, dependencies, and critical paths.
- You can also build assignments to run automatically and manage dependencies. This ensures both, a better team as well as time management.
- Zoho Projects has great tools for working together. You can give team members work, set due dates, and see real-time progress.
- The program also has texting and feedback tools that you can use to share files and data with your team.
Rating:
4.3 / 5
Pricing:
- Free
- Premium – $3.35 per user per month
- Business – $7.54 per user per month
5. ProProf Project
ProProfs Project is a tool for managing projects that also helps you create a Gantt chart view. This makes it easy to schedule and manage work.
How Can ProProf Project Help You?
- You can give your team tasks and subtasks with clear due dates and make sure everyone knows who is accountable for what.
- Furthermore, drag-and-drop feature makes it easy to move things around if you want to make changes.
- The Gantt chart view in ProProfs Project can help you find assignments that are conflicting and holes in the process.
- In this way, you get to keep an eye on your assignment and make the best use of your tools to get the most done.
- The tool also has project reports that give you information about important project data that can help you make better choices.
Rating:
4.4 / 5
Pricing:
- Free (up to 5 users)
- Business (Unlimited Users) – $39.97
Best Tips for Gantt Chart Optimization
Minimizing delay time in Gantt charts calls for both careful planning and the application of several techniques.
Using these techniques will help you improve output, simplify processes, and effectively execute projects.
- Task dependencies cause intervals between activities, therefore affecting lead time. Whenever Task B depends on Task A, project managers can examine any excess dependencies and minimize them immediately.
- Minimizing task dependencies will help to lower delays and enable more simultaneous and simplified delivery.
- Learn how to simplify procedures to cut out obstacles and inconsistencies. You can always apply Lean or Six Sigma as a process improvement technique.
- Value stream mapping, for instance, may help you see job flow and pinpoint locations where lead time might be cut back.
- Proper resource allocation will help you lower queues and increase output.
- Apply strategies and tools for resource management to carry out tasks like juggling supply and demand.
- You should always use Scrum and Kanban to effectively manage Gantt charts. They too help in stressing progressive and continuous delivery, thereby enabling reduced lead times and quicker feedback.
For project managers trying to boost project results, overall knowledge and optimization of lead time on Gantt charts are essential.
You can fully apply Gantt charts as a tool for project management by:
- Understanding lead time principles
- Grasping the foundations of Gantt charts
- Using techniques to maximize lead time and thus attain effective project delivery.
Conclusion
Creating a Gantt chart might seem daunting at first, especially if you’re unfamiliar with project management tools. Throughout this article, we’ve broken down the process into clear, manageable steps.
Remember, practice makes perfect, so don’t hesitate to experiment and refine your charts as you gain experience.
Whether you’re managing a small team or planning a complex project, a well-crafted Gantt chart will be your go-to tool.
Ready to start creating your own Gantt chart? Try Chisel today and take your project planning to the next level!
Interested In More PM Related Content? Try Reading :