
What Is a Gantt Chart?
Gantt Chart Definition
“A Gantt chart is a project management tool that assists in planning out all projects, especially complex ones. This bar chart guides project managers and other teams to get a bird’s view of the project’s deadlines, tasks, and milestones.”
Gantt chart, named after its inventor Henry Gantt, is a type of bar chart that illustrates a project schedule.
The Y-axis of a Gantt chart shows the tasks you need to complete, while the X-axis represents time. As you input tasks, start dates, end dates, and dependencies, the bars populate, representing task durations.
Today, Gantt charts are helpful for tracking project schedules. It helps if we can show additional information regarding various project phases, like what is left, how the tasks are related, and so on.
For any project manager, a Gantt chart helps to plan the project perfectly, stay ahead of the tasks, and always be able to track the progress of the project accurately.
Originally Grant charts had to be prepared by hand. This hand drawing of diagrams required a lot of work as a project detail changed each time. It was difficult to amend the chart.
In most cases, the users had to redraw the chart entirely, taking a lot of time for the managers and thus, limiting its usefulness.
However, with the advancement of computers and project management software, like Jira, the owners rectified this issue as it became effortless to create/update a Gantt chart.
How to Use a Gantt Chart?
Creating a Gantt chart is pretty simple. However, managing the chart is tricky. Using the following example, we will see how to use Gantt charts.
Suppose we want to open up a store in three weeks.
We will discuss three ways to use a Gantt chart below:
Sort Out Your Project Into Groups
Always divide your project into small sections, referred to as groups. Your main heading will be to open up a store, and the division of groups follows. In this project, we have three groups: finding a place, getting a license, Interiors, and openings.
Insert Tasks in the Groups
Now, add the relevant tasks in each subgroup. Also, put a milestone in each sub-group. Milestones indicate that the work in that group is completed, and the teams can move on to the next groups.
Another point to add to the subgroups is to add timelines for each task.
For example, in our store opening for interiors, we have tasks of measuring the entire store space, getting furniture for the different columns, and so on.
Consider Dependencies of Each Task
Once you have added the tasks to each group, it’s time to add the dependencies. Dependencies are related to each task, and when you change a task, you also need to change the dependencies.
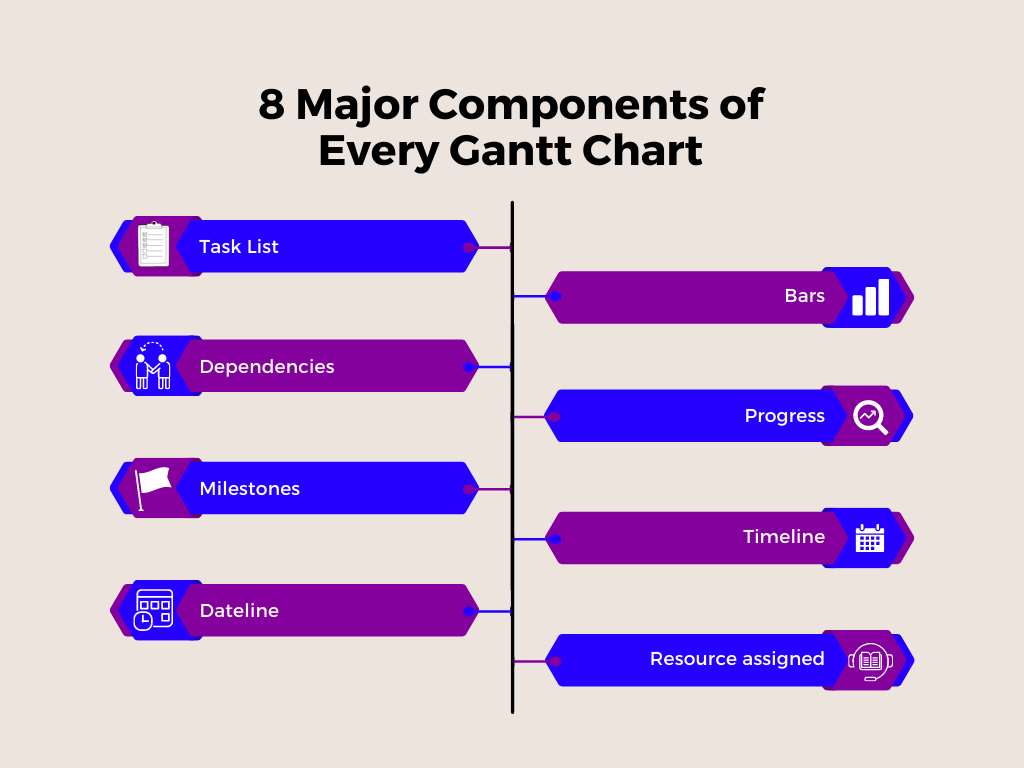
What Does a Gantt Chart Show?
A Gantt chart will show your project tasks in order. It will also include dependencies which is the relation of one task to another. Your Gantt chart will also determine and display your resources.
With the help of a Gantt chart, you can also see the probable risks and problems you might encounter in the future. It will create a contingency plan for you to avoid these problems.
What Is Gantt Chart Used For?
You can utilize Gantt charts to plan and manage different projects in various industries. Any business that follows a ‘process’ could use the Gantt charts for project management.
At the beginning of a project, you can use a Gantt chart to display its scope by visualizing its critical path.
A “critical path” in project management refers to a sequential path of dependent tasks that you must finish to complete the project on time.
Gantt charts help project teams to work together effectively on their projects and help bring everyone on the same page. The team leads and project managers must make sure that all the team members share the same information about the project so that they don’t have to brief them about the project’s progress every time.
Gantt Charts make it very easy to manage tasks and their dependencies. A team member could instantly know the task assigned to them and how their contribution would bring value to the project. It helps to keep their morale upbringing a positive attitude around the project.
How to Read a Gantt Chart?
Reading a Gantt chart might feel challenging when you are just starting as a project manager or even new to the team. Navigating through the Gantt chart will not be easy with many boxes, arrows, and lines. But this article has already shown you how to use the Gantt chart, so now you know what it includes.
The three elements are project tasks, timelines, and dependencies.
You can also watch youtube videos that will clearly explain how to read a Gantt chart.
Purpose of Gantt Chart in Project Management
- Gantt charts help project managers to plan and schedule their projects.
- Another purpose of Gantt charts is to help you assess the time your project will take to reach its completion stage.
- Gantt charts guide you in determining the resources your project will require.
- The most crucial purpose of Gantt charts is to carve the path to reach your goals most efficiently.
- Gantt charts aren’t limited to helping you before you start your projects. They can also show you if you are lagging. It also indicates you could have achieved specific tasks. You can then take action.
What Are the Benefits of the Gantt Chart?
Improve Team Productivity
The Gantt chart provides live information on the project’s progress to all the stakeholders.
A team can easily keep up with the project with full knowledge of what is coming next.
It helps get aligned on time, thereby improving the team’s productivity.
Beyond this, it enables team members to adopt transparency and accountability with ease.
Team Communication
Communication forms an integral part of a project’s success or failure. Gantt charts help project managers provide crystal clear communication.
They can use these charts to know who is working on what and provide insights on specific tasks. It also helps them interact better with the team members and enhances their relationship as a team creating a favorable work environment for everyone.
Good Use of Resources
Gantt charts let you use your resources correctly as you get to see an assignment’s timeline. That way, you can see how and where you utilize your resources.
Within Gantt charts, you may additionally delegate responsibilities and align resources without burdening anyone. In this manner, you may effectively manage assets, and when assets are well organized, tasks are more likely to be finished within budget and time limits.
Boost Flexibility
A project first may appear to be foolproof, but in any case, you should prepare the team for any adverse situations that may arise during the project. A good Gantt chart tool could help organize a project to deal with these hiccups aptly.
Gantt chart allows a team to be flexible, keeping them focused on their final goals.
Disadvantages of Gantt Chart
- Gantt charts require a lot of time to set up. It is not necessarily intuitive, especially if you try to include task links from the traditional project management software.
- There are always a lot of dependencies to deal with – finish-to-start, start-to-start, and so on. Integrating this level of detail into the chart can be a cumbersome task, thus making the Gantt chart impractical in some cases.
- Maintaining the Gantt chart can be confusing. Gantt charts can be a great tool to generate the first view. However, as the project goes on, it could be very challenging to keep the Gantt chart and Gantt chart dependencies updated, especially if you have a lot of stakeholders in the project.
The non-project manager stakeholders need a thorough explanation of the details of the Gantt charts since the charts themselves are not necessarily self-explanatory. Therefore, once you draw the initial outline, the team generally moves on to better tools to manage the project.
- Once you start adding many details to the chart, it becomes messy. Having a lot of information in the Gantt chart can make it difficult for the team members to understand it properly.
You might have to zoom into the chart many times to locate a particular task detail. That could lead to team members missing out on much more significant and critical aspects of the project.
FAQs
Proofhub, nTask manager, Celoxis, and GanttPro are good tools.
Gantt chart was firstly created by Polish engineer Karol Adamiecki in 1896. However, the version of the American engineer Henry Gantt later in the early 20th century was adopted worldwide.
You can use a Gantt chart when:
- You have a lot of tasks on your plate
- You have no sense of direction during project management
- You need to track and report projects
Dependencies are the tasks that require input from other tasks to be completed or activities that can’t start until you complete the previous action.