Gantt Chart Dependencies: Understand and Manage
This article covers:
When building a house, you don’t start with the structure or the floor first, right? That’s next to impossible. You will require a foundation to build something on. It is because the structure of the house is dependent on the foundation.
Similarly, projects and tasks in product management are also dependent on one another. No tasks can happen single-handedly.
The outcome of a product is the amalgamation of several tasks. Therefore each task has a specific order you must fulfill to begin the next task. This is known as dependency.
But you are right in saying what does the Gantt chart refer to and how will it help your team and the organization?
This guide will explore everything you need to know to begin using the Gantt chart. Right from what Gantt chart dependency means, the ways to set, track, and manage these dependencies effectively, and the solution to the problem of where to find the Gantt chart inbuilt in the workspace.
You are at the right place. Let’s dive right in!
What Is Gantt Chart Dependency?
Usually, product teams represent their task dependencies on a Gantt chart. We will divide the entire term of Gantt chart dependency into two.
Gantt chart refers to the bar chart that helps to visualize the progress of a project. It is, therefore, the best tool to manage the project dependencies since it tells you the process from the start till the end of the project.
Dependencies in the Gantt chart are the tasks that are related to one another in a project.
Gantt chart is a visualized timeline also known as work dependency. The chart includes horizontal bars which represent the tasks that are laid across the timelines. Every bar represents the start and the end date of the task or the project.
With Gantt charts, you can properly schedule your projects and also plan your day-to-day tasks and certain activities.
It is especially useful for stakeholders because they can view the timelines of each task and look at the bigger picture and accordingly understand the outcome of each task.
Gantt chart dependencies show you the exact relation between every task along with the timeline of each task.
When you have this information at your fingertips, it becomes easier to identify the roadblocks and forecast the resources.
Product managers can easily see how every task moves into the other. They can then note down necessary resources that they will require to keep things running smoothly. Doing so is especially necessary for certain complex tasks which involve various teams.
Why Are Gantt Chart Dependencies Important for Your Projects?
Product managers and teams must follow a certain order when working on a project. It can’t be like a list or errands you need to run in any order as long as the task is tick marked.
It will be disastrous if there’s no specific order to do the tasks of a project.
The best way to go about any project is to plan tasks in order, track and manage the dependencies.
Having a Gantt chart in place right from the beginning of the project is necessary because as the project progresses, it gets complex.
In such times, knowing the dependencies is very crucial.
Knowing about the dependency makes everyone on the team ready for obstacles since everyone knows the dependencies for the tasks.
Communication of the dependency status becomes easier with the Gantt chart.
The best part about the Gantt charts is that if something goes wrong with the project, saving it becomes a less cumbersome task since you know the dependencies. You can make specific changes to the dependent tasks and go ahead with them.
To summarise, Gantt chart dependencies are essential for your projects because of the following reasons:
- You can plan tasks by taking into consideration all the dependencies
- Structure tasks in order, thereby avoiding errors
- Know the tasks in all transparency
- Estimate the time you’ll need for the completion of tasks and not miss deadlines
- Avoid scheduling overlapping tasks
How To Set and Track Dependencies?
Now that we are clear on dependency and Gantt charts, let’s understand how you can easily set and track dependencies on Chisel.
They aren’t as complicated as the types of dependencies of FF, SS, SF, and FS.
Let’s see how you can set and track dependency status in a few steps.
The Treeview pillar in Chisel has the ‘Dependency’ section that allows you to expand it and add dependencies.
There are two sections for you to customize your dependencies.
- Dependency
This will include all the tasks or departments the tasks are dependent on to begin the next activity. For example, UX, sales, engineering, and so on.
- Dependency status
The dependency status will include the progress of the tasks in the pipeline. For example, completed, blocked, in progress, and so on.
Adding, hiding, or deleting dependencies is easier simply by toggling off or pressing the deleting button.
Once you have set the dependencies in the side panel, it’s time to set and track them corresponding to the features.
By expanding the ‘select’ button in the dependency tab, you can add your dependency statuses.
Bonus: Find out more about How To Use Dependencies?
Try Chisel for Gantt Chart Solution
A simple google search for “how can I make Gantt chart” will give you results suggesting you try doing it in doc or an excel sheet.
Don’t fall for it!!
There are two reasons for this:
- Designing and managing the Gantt chart in the excel sheet will need more effort
- When updating the chart, you will waste your time.
Also, why waste your time and effort on something with a SOLUTION?
Why go the traditional route when Chisel does all of that in just a few clicks?
Let’s look at the step-by-step guide on how you can use Gantt Chart software like Chisel to manage and track your dependencies using the Gantt charts.
Step 1: Create a Gantt Chart in the Timeline View
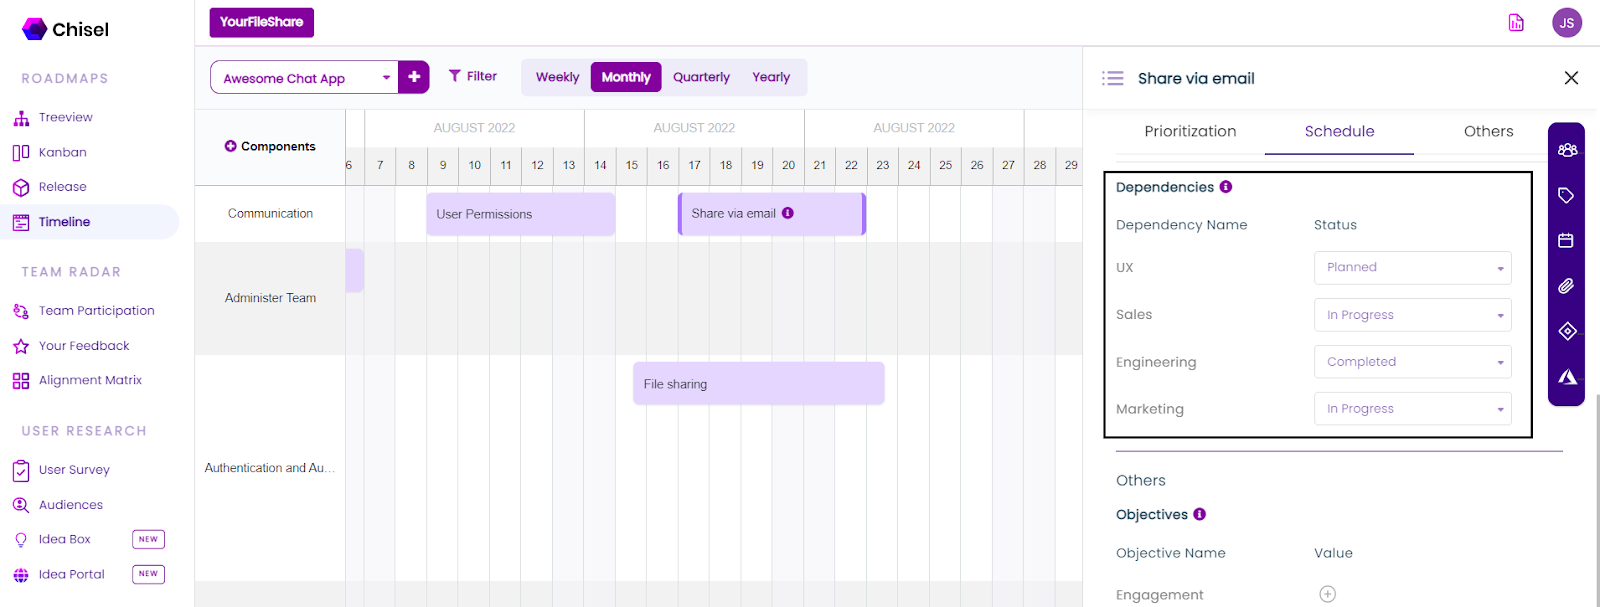
There are various ways to set a dependency in the treeview pillar. You can either do it by clicking on the ‘select’ button in dependency or open the feature and go to the ‘schedule’ section and give your dependency status from there.
All this dependency information will be automatically available in the timeline view of the Gantt chart.
However, if you decide to add the dependency or the feature in the timeline view individually, there are other simple steps you can follow.
Step 2: Schedule Tasks by Giving Them Timelines
In the Timeline view, click on the timeline you wish to add the feature to; give the feature’s name, description, and timeline, of course.
Set timelines by clicking on the feature in the timeline view and going to the schedule part. There’s another simpler way to do so too. You can simply extend or shrink your features as per the timelines you wish to set.
Step 3: Set Dependency, Delete, Track and Manage
Adding dependencies in the Gantt chart may seem challenging. You may think, how can I put task a dependency on task b and so forth?
However, it’s an easy task to add task dependencies.
As we have seen in the earlier steps, you simply need to open the feature in either the timeline Gantt chart or the treeview.
Scroll down to the schedule tab and add dependencies such as completed, in progress, etc.
You can also add milestones easily by clicking on the + milestone button in the Gantt chart. All you need to do is to give a name and description along with the timeline for your milestone.
It will be displayed at the top of the timeline page in the Gantt chart.
Viewing your dependencies is not just limited to the Gantt chart. Chisel allows you to switch from one view to another easily.
You can view and track your dependencies with the kanban view, release view, and treeview.
Step 4: Drag and Drop Your Tasks
Say you have set the dependencies in the Gantt chart, but there’s some change you need to make to the timeline. However, going the regular way of adding the dependency in the side panel is not the way you want to take it.
Simply drag, and rearrange the feature timeline.
Step 5: Share the Gantt Chart With Your Stakeholders
The project you are currently working on will have members not just limited to the teams but also clients and stakeholders.
Not everyone can be a part of the workspace. If you need to add them, you can always do that by inviting them to your workspace. However, when they can’t join but will be more than interested in keeping up with the project, how can you do so?
Chisel has that tool too!
To keep track and record the work progress in the Gantt chart for that particular moment, you can ‘export’ the timeline data, and the pdf file will be stored in your download folder.

When you need to share the progress of the project with your stakeholders, simply go to the ‘roadmap reports’ button at the top right corner anywhere in your workspace.
Generate a report by selecting a timeframe and adding necessary filter options.
The roadmap report consists of the name and components of the feature, the prioritization and alignment scores, and the breakdown of each score.
The other details are release and kanban statuses, score differences, and so on.
When To Use a Gantt Chart With Dependencies?
Most projects will involve a lot of teams and multiple people. In times like those, having a Gantt chart at your disposal is very important because it makes your work efficient.
Since Gantt charts enable you to view entire projects’ tasks in a singular palace, keeping a tab on the efforts of every team member is easier.
Having data on resources and how and where to allocate them is essential, especially in complex projects. With the Gantt chart, you can view every activity in detail, including each task’s start and end date and output. Due to this, you can efficiently allocate resources and keep the project flowing.
Gantt charts also come in handy when you have to show the data to people in the hierarchy who aren’t necessarily involved in the day-to-day tasks.
Pro tip: For example, when you have to report to the executives regarding the project status, you can show them the Gantt chart because it illustrates the project’s progress with every task.
Convincing executives with visuals increases influence rates by 43% when you want to bring in more resources.
You get the twofold benefit of a better success rate with your executives and even better planning of your project, everything in a single tool.
Count On Chisel To Manage and Execute Your Tasks Seamlessly With Gantt Charts
By now, you know that successfully managing dependencies is effective when you have to deliver a product.
You can achieve more in less time because you have a Gantt chart inbuilt in your workspace, which lets you monitor, streamline projects, and report efficiently. All under a single roof.
This is why Chisel’s treeview pillars let you add dependencies and visualize them according to the timeline view.
More like this:
- Task Dependencies: Importance, Types, and Management
- What is a Dependency?
- What Is a PERT Chart? Definition and Create (+Examples)
- PERT Chart vs Gantt Chart
- How Do Product Managers Collect Customer Feedback?
- How to Prioritize Product Roadmap With Matrix?
- Customer Feedback Loop: How to Create & Close it
- How Do You Make a Kanban Board?