How to Make Data-Driven Decisions in Product Management

As product managers, we constantly balance many moving pieces – customer needs, technical constraints, market trends, and more. Getting pulled in different directions can be easy as we determine the best path forward. But having insight into how your customers use your product gives you an important anchor.
We’ve found that a data-driven decision-making approach leads to better outcomes. As per the McKinsey Global Institute, companies that rely on data are 23 times more likely to gain more customers, have a sixfold higher likelihood of customer retention, and have a 19 times greater chance of being profitable.
In this article, we have picked a few tips we’ve picked up on how product teams at our company make data-driven decisions:
Without big data analytics, companies are blind and deaf, wandering out onto the web like deer on a freeway “
Geoffrey Moore
We’ll dive into specific metrics, how to analyze the data as a product management team, and examples of how the insights can help guide product roadmaps. We are confident that our insights will benefit you all in taking an evidence-based approach.
So let’s dive right in, shall we?
The Data-Driven Decision Traps That Even Smart PMs Fall Into
Product managers need help with a few common pitfalls when focusing on data. Looking at numbers alone gives you clear answers. Still, the data often raises as many questions as it solves.
One challenge is falling in love with vanity metrics. A lot of early-stage startups obsess over downloads and users. Still, those figures tell you little about retention or engagement. According to an Amplitude study, the commonly used “N Day” retention metric might significantly underestimate the percentage of users who return to apps. Product managers sometimes have to nearly redesign their whole product roadmap around boosting installs before they look closer at who is coming back consistently.
Another trap is mistaking correlation for causation. Just because two metrics rise together doesn’t prove one is causing the other. We often see a spike in watch times that coincide with a new feature, so we assume people love it. But after A/B testing, we find it makes no difference at all. Always validate assumptions with controlled experiments.
A third common mistake is focusing too narrowly on quantitative data. While the numbers can be significant, qualitative feedback provides valuable context around why people use different features. For instance, user interviews reveal that people return not because of the feature changes but because of engagement in the user communities built. This can help shape where teams need to focus on development.
The key is gathering data and having frameworks to properly analyze it together as a team. Data alone won’t automate decisions – it takes experience, collaboration, and testing different hypotheses to leverage insights to improve your product and customers truly.
How to Make Data-Driven Decisions in Product Management
- Define key metrics
- Collect both quantitative and qualitative data
- Set up dashboards and reports
- Analyze trends and outliers
- Gather feedback from diverse teams and customers
- Test hypotheses with rigorous experiments
- Make changes gradually based on the evidence
- Continuously learn and improve processes.
Getting the correct data is only part of the challenge – analyzing and learning from it as a team is equally important. We focus on qualitative and quantitative data to understand how customers interact with the product.
Now, let’s deepen our understanding. Shall we?
Define Key Metrics
The first step is deciding what success looks like for your product and customers. Product managers usually work closely with their marketing, support, and success teams to understand business goals and customer pain points. From there, they identify the 4-5 most important metrics that reflect their objectives.
For example, If your goal is to maximize the adoption of premium features, one key metric to track is conversion from free to paid plans. You can also look at metrics like 7-day retention to gauge sustained engagement over time.
Research shows that choosing and defining the right metrics can boost business and are the top indicators of long-term customer value. With a focused set of measures, we can align priorities and have an agreed framework for evaluation.
So, stuck in the metrics maze?? Don’t worry; we have just the right place for you to get started.
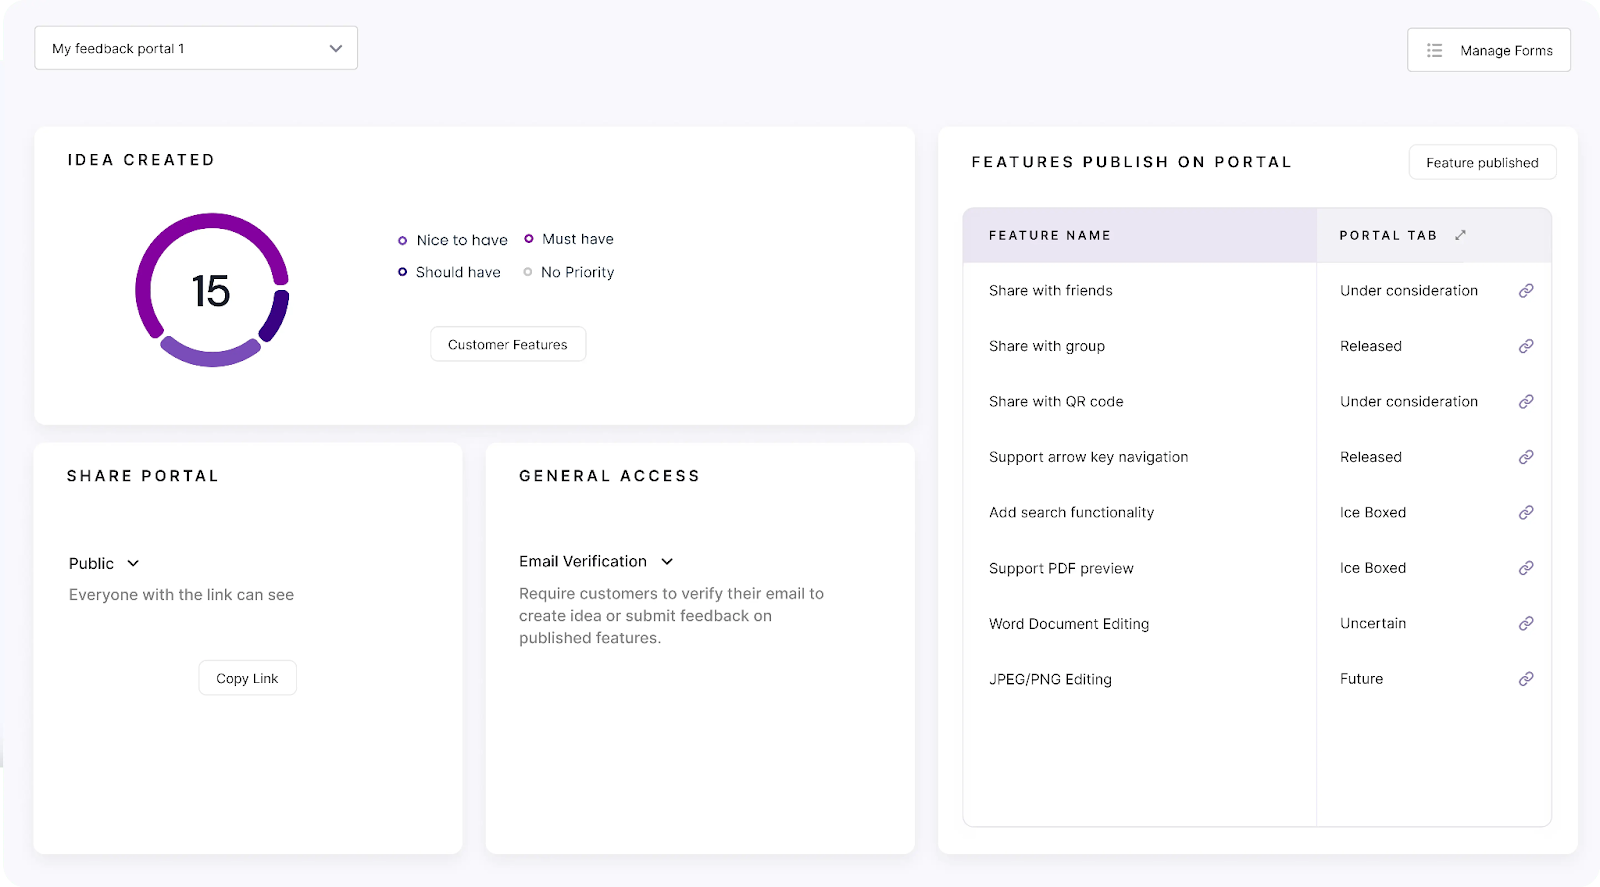
Try Chisel’s integrated features. The feedback portal alone could save so much time and effort. Automatically capturing all ideas and suggestions in one centralized idea box gives you a complete picture of what customers want most.
Rather than scrambling through emails and forums, you can easily tag user requests in the tool and see which metrics matter the most.
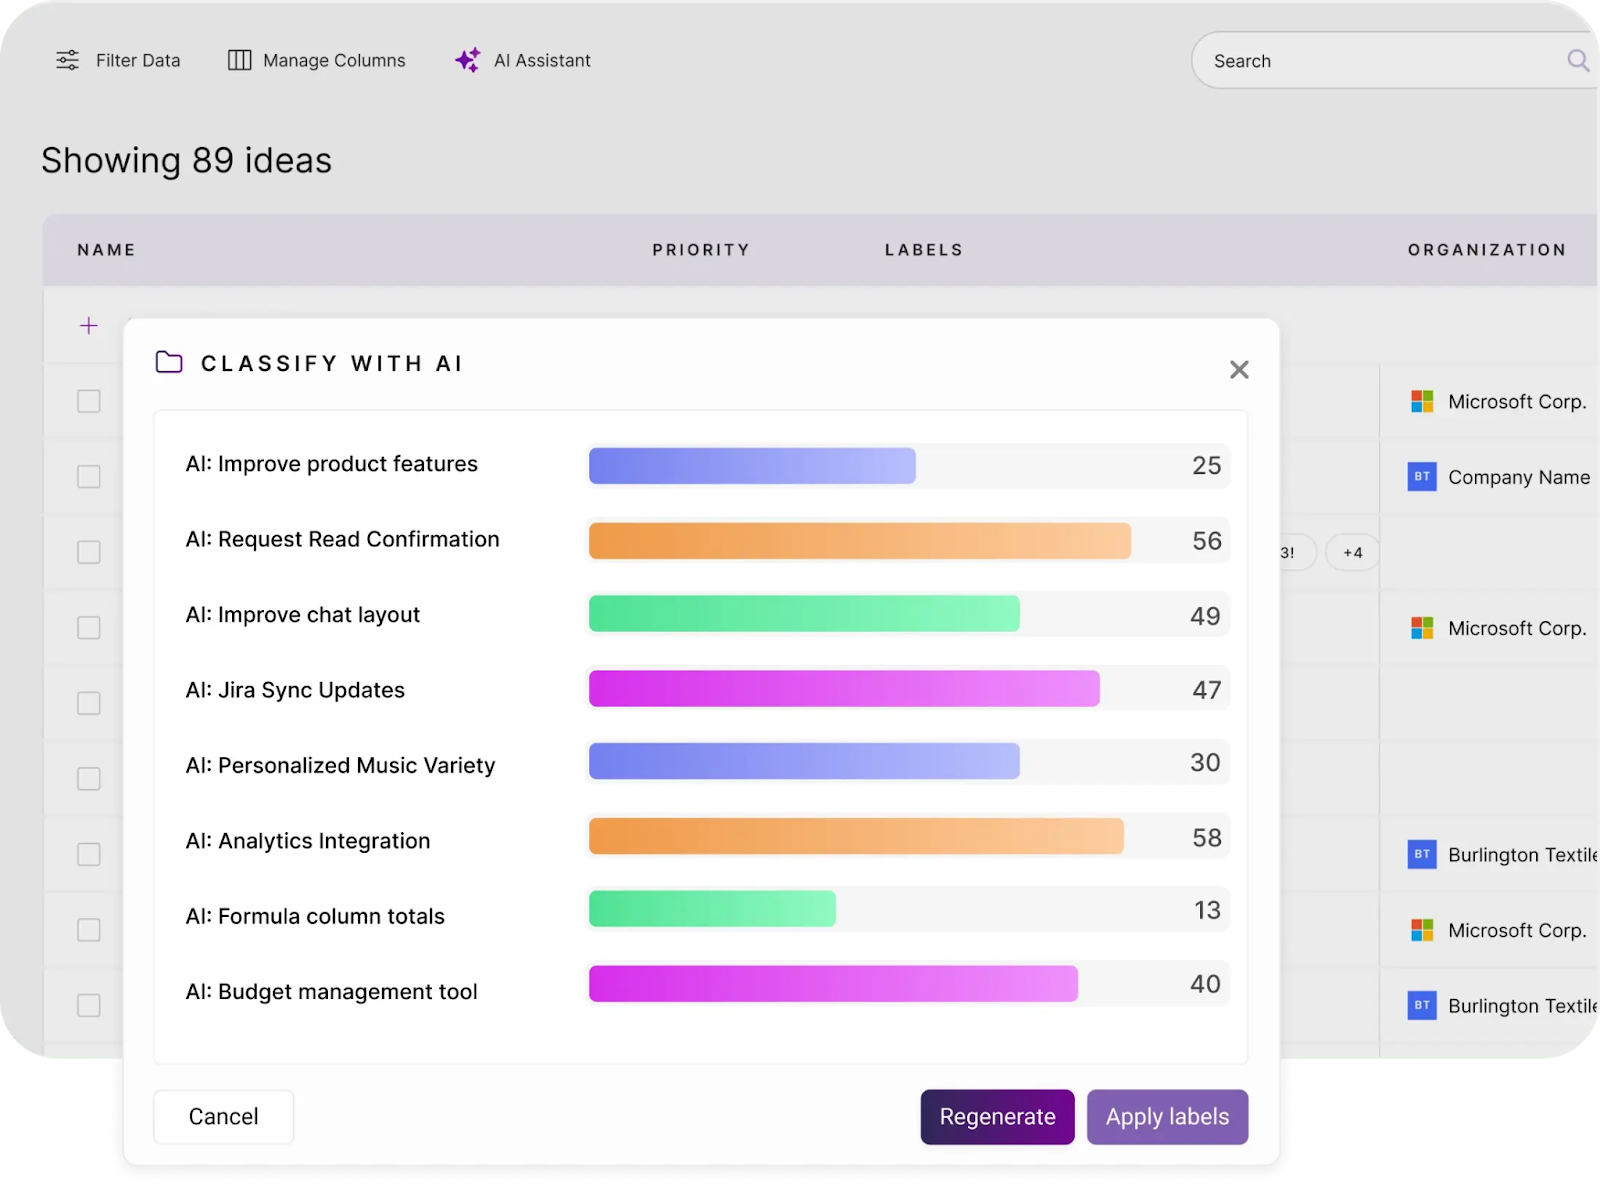
Product managers can also leverage the team participation feature. Inviting feedback from colleagues across teams can allow you to align on what metrics you should prioritize. Chisel’s alignment matrix will clearly show where you all agree new features tie into important KPIs like retention or revenue. No more wasting cycles debating definitions.
Collect Both Quantitative and Qualitative Data
Quantitative data from analytics gives us complex numbers to analyze trends. Qualitative data provides the why behind customer behaviors. Product teams should conduct regular user interviews and surveys to learn directly from customers in their own words.
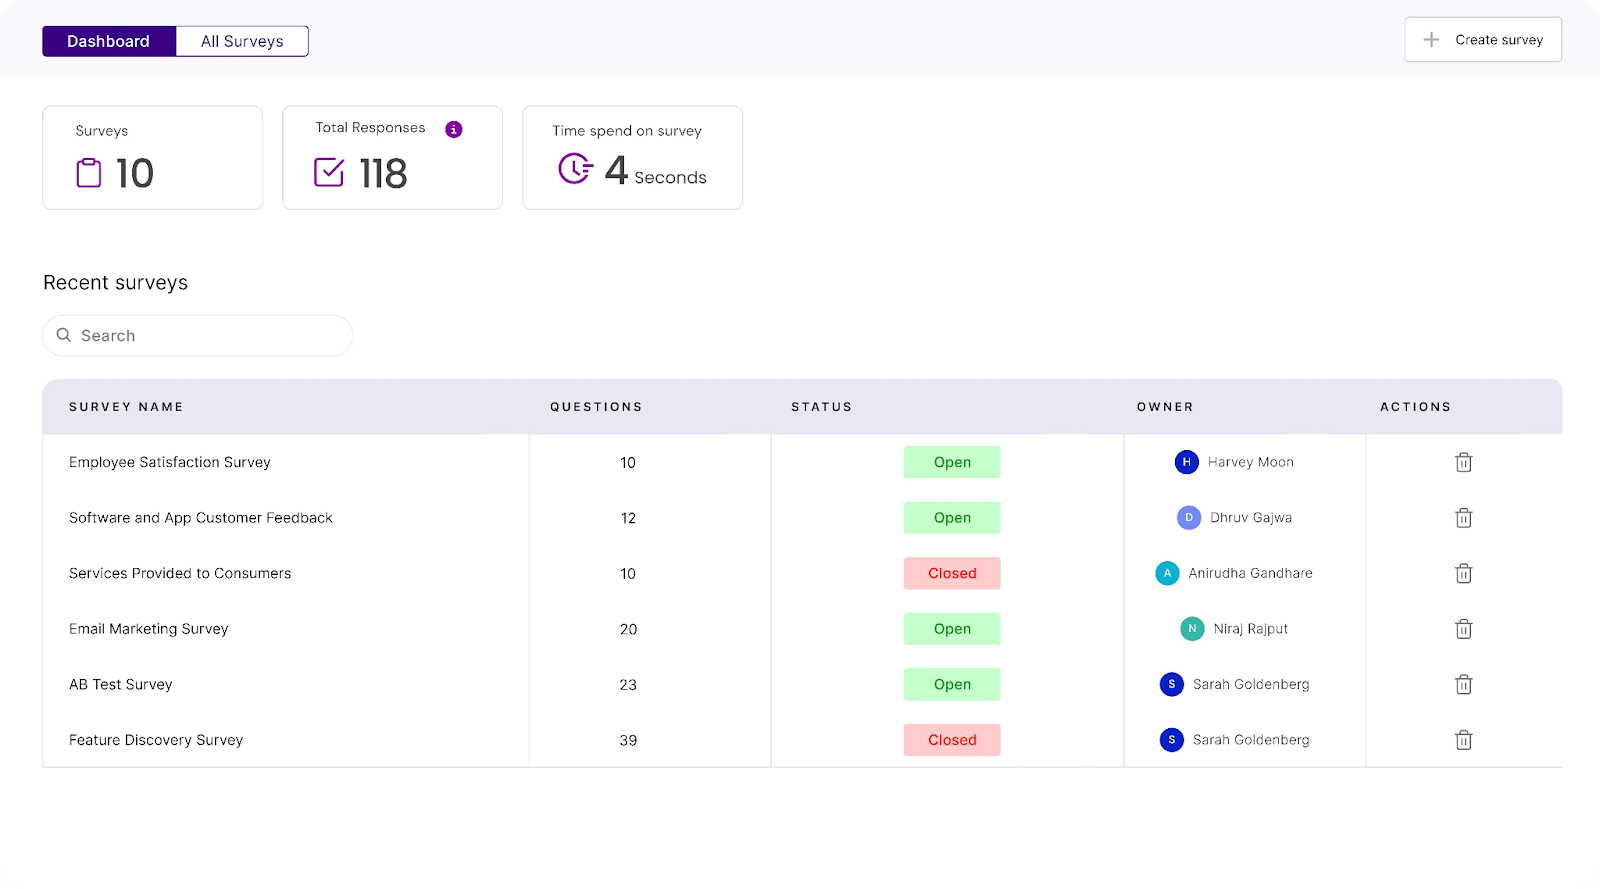
For starters, you can use Chisel Surveys to address standard use cases.
The versatile survey tool helps you efficiently conduct pre-launch user needs assessment surveys, post-launch product and usability feedback surveys, and much more, which can be indispensable to gathering qualitative and quantitative data.
This provides invaluable context around frustrations or positive experiences that may not be directly traced elsewhere.
Bringing quantitative and qualitative data together allows for a multidimensional perspective on how the product is received and used. Quantitative findings can be tested through additional qualitative inquiries to get a complete picture before enacting changes. The combination keeps you from falling victim to personal biases or misinterpretations from limited data points.
Set Up Dashboards and Reports
Having the right analytics tools is essential because the data is accessible. Product managers should then use a customer analytics platform to track their metrics and aggregate them into clean dashboards.
This will allow any team member, regardless of technical experience, to view current performance and trends quickly. To identify correlations, you can visualize key metrics over time alongside related secondary measures. Interactive features let you drill down to analyze specific segments in more detail.
Regular report distributions keep essential findings at the top of decision-makers’ minds. To foster cross-team awareness, distribution lists include product managers, product marketers, success teams, and more. Summary emails highlight significant changes or anomalies to spark questions and conversations.
Analyze Trends and Outliers
More than looking at numbers flying upwards, what is needed is that teams dig deeper into what’s driving shifts over weeks and quarters. Steep growth could mean widespread happiness or edge case misuse. Declines might point to overlooked problems or seasonality.
There can be endless such stuff, you see?
Let’s look at a few examples of such trends.
Diving into segment breakouts by client size, industry, or plan type often reveals inconsistent patterns worth exploring. Geoviews can show surprising regional variances to localize investigations.
Outlier events like sudden traffic spikes through social promotion require careful consideration, too. You can always compare before/after metrics like conversion or response times to quality check relationships.
Now, it’s essential actually to have the necessary insights accessible in one centralized place rather than scrambling through emails and spreadsheets. Chisel can be a game changer for aggregating all metrics, feedback, and engagement data trends in one convenient dashboard.
You can quickly scan for anomalies – like a sudden dip in retention or a spike in support tickets on a particular feature.
Spotting these variations helps uncover where we must refine or rethink our approach. Are users struggling with something that needs simplifying? Did a new competitor disrupt our space? Letting the numbers guide further investigation is so valuable.
Gather Feedback From Diverse Teams and Customers
Product managers should conduct surveys and interviews, tapping various groups for a well-rounded perspective.
When you engage with varied perspectives, experiences, and backgrounds, companies can gain valuable insights that contribute to a more comprehensive understanding of user preferences and needs.
You can only truly understand product fit with input from various perspectives. Chisel’s team participation tools have been great for gaining a holistic view beyond just the individual experience. The tool surfaces differences in meaningful conversations by making it easy for anyone – from marketing to engineering – to vote on priorities.
Another critical feedback to gather is the Users’ You can seamlessly do that in Chisel in no time & all in one place.
The feedback portal & Idea Bos gives autonomy to all user types to share ideas, not just the loudest few. This inclusive process helps ensure you’re building for the whole population, not just a subsection.
This inclusive approach enhances the quality of products and promotes a sense of belonging and customer satisfaction. Companies can address various concerns through open communication channels, identify potential improvements, and build stronger relationships with diverse stakeholders, ultimately driving continuous growth and success.
Sign up for Chisel’s Free Forever Version here.
Test Hypotheses With Rigorous Experiments
Ultimately, the actual test is how real people respond.
While data and feedback inform hunches, you can always prove assumptions through controlled experimentation before company-wide launches. Variations like new flows or features roll out gradually to filtered cohorts randomized by traits like geography or engagement levels.
A/B tests employing multivariate testing methodology isolate the precise impacts of isolated variables. This scientific approach to small-batch learning swiftly confirms or rejects ideas with definitive metrics instead of ambiguous general use.
Chisel provides multiple integrations that can directly integrate with your product experimentation platform to design, launch, and analyze controlled experiments. Split-testing hypotheses can help you determine causation versus simple correlation when tweaks go live.
Key Takeaways
Making data-driven decisions certainly isn’t a simple or automated process – it requires gathering insights from multiple qualitative and quantitative sources, analyzing findings together as a team, and rigorously testing hypotheses through experimentation. But when done systematically and continuously improved upon, it can guide product work in compelling ways.
For any team hoping to strengthen their approach through evidence, the steps may seem daunting – but small shifts make a difference. With openness, rigor, and a commitment to constant advancement, data can transform decision-making from an uncertain process to an empowering learning experience.