How to Choose the Right Metrics for Your Product

Have you ever spent months developing a new product feature to launch it to a lackluster response? Or watched helplessly as customer retention dropped but couldn’t identify the root cause?
Choosing the right metrics to measure your product’s performance is critical to avoiding these painful situations. When selecting metrics, it’s easy to get caught up in tracking trivial details that don’t impact your business. But how do you know which data truly matters?
With so many possible options, deciding on the most important metrics to focus on can feel overwhelming. Tracking too much brings analysis paralysis, while too little leaves you blind to real issues.
The stakes are high because the metrics you select will dictate how you prioritize roadmaps, allocate resources, and make strategic decisions going forward. Get them wrong, and you risk wasting effort on unimportant areas while missing opportunities to improve user satisfaction and retention. That is the reason we have created this article to help you make most effective decisions while choosing the right product metrics.
By the end of this guide, you’ll understand how to categorize essential metrics for your product. You’ll also be able to assess your metrics and potentially identify any gaps, avoiding common pitfalls others have experienced. Does understanding your users and ROI better sound helpful? Then, let’s get started.
Most Product Managers Are Using the Wrong Metrics. Don’t Be Like Them
The success of a product manager often depends on their ability to choose and measure the right metrics. Unfortunately, many product managers make the mistake of using the wrong metrics to evaluate their products, leading to misguided decisions and wasted resources.
Here are some common mistakes to avoid when choosing product metrics:
- Relying on vanity metrics. Vanity metrics may look impressive on paper, but they don’t provide meaningful insights into the success of your product. Examples of vanity metrics include total downloads, website traffic, and social media followers.
- Focusing on outputs, not outcomes. Outputs are actions you take, such as releasing a new feature or launching a marketing campaign. Outcomes are the results of your actions, such as increased user engagement or revenue. It’s essential to focus on metrics that measure outcomes, as these are the ones that have the most significant impact on your business.
- Ignoring user feedback. User feedback is critical for determining what your customers want and need. Product managers should prioritize metrics that reflect user satisfaction.
- Short-term thinking. It’s easy to focus on short-term metrics, such as immediate revenue boosts or rapid user acquisition. While these are important, tracking long-term metrics, such as customer retention, lifetime value, and overall product sustainability, is also essential.
- Benchmarking against competitors only. Competitive analysis is essential but not the only factor to consider when choosing product metrics. Relying too heavily on your competitors’ actions can lead to a copycat mentality rather than focusing on developing a unique product value.
This article won’t regurgitate the same old product management metrics that have become commonplace. Instead, it will dive deep into why traditional approaches are misleading and why breaking free from the herd is crucial.
To truly understand what makes your product successful, you need to challenge the status quo and look beyond the surface-level data.
How to Choose the Right Metrics for Your Product
Choosing the right product metrics is crucial for measuring the success and progress of your product. To ensure that you select the most appropriate metrics, consider the following steps:
- Start with Clear Goals
- Understand Your Target Audience
- Identify Key Performance Indicators (KPIs)
- Use the North Star Metric
- Consider Leading and Lagging Indicators
- Avoid Vanity Metrics
- Balance Quantitative and Qualitative Data
- Consider Cohort Analysis
- Set Baselines and Benchmarks
- Iterate and Evolve
Step 1: Start with Clear Goals
What do you want your product to achieve? Do you want to increase user engagement? Reduce churn? Boost revenue? Once you know your goals, you can choose metrics to help you measure your progress.
For example, if your goal is to increase user engagement, you might track metrics such as:
- Daily active users (DAUs)
- Monthly active users (MAUs)
- Average session duration
- Number of pages visited per session
- Number of features used per session
If your goal is to reduce churn, you might track metrics such as:
- Churn rate
- Customer satisfaction score (CSAT)
If your goal is to boost revenue, you might track metrics such as:
- Revenue per user (ARPU)
- Conversion rate
- Lifetime value (LTV)
It’s important to note that there is no one-size-fits-all approach to choosing product metrics. The right metrics for your product will depend on your specific goals and business model.
Step 2: Understand Your Target Audience
Who are your ideal customers? What are their needs and pain points? What are their goals? Once you analyze your target market, you can choose product metrics to help you measure how well your product meets their needs.
For example, if your target audience is small business owners, you might track product metrics such as:
- Time saved using your product
- Increased revenue generated using your product
- Reduced costs using your product
- Improved customer satisfaction ratings
If your target audience is millennials, you might track metrics such as:
- Social media engagement with your brand
- Number of user-generated reviews
- Net promoter score (NPS)
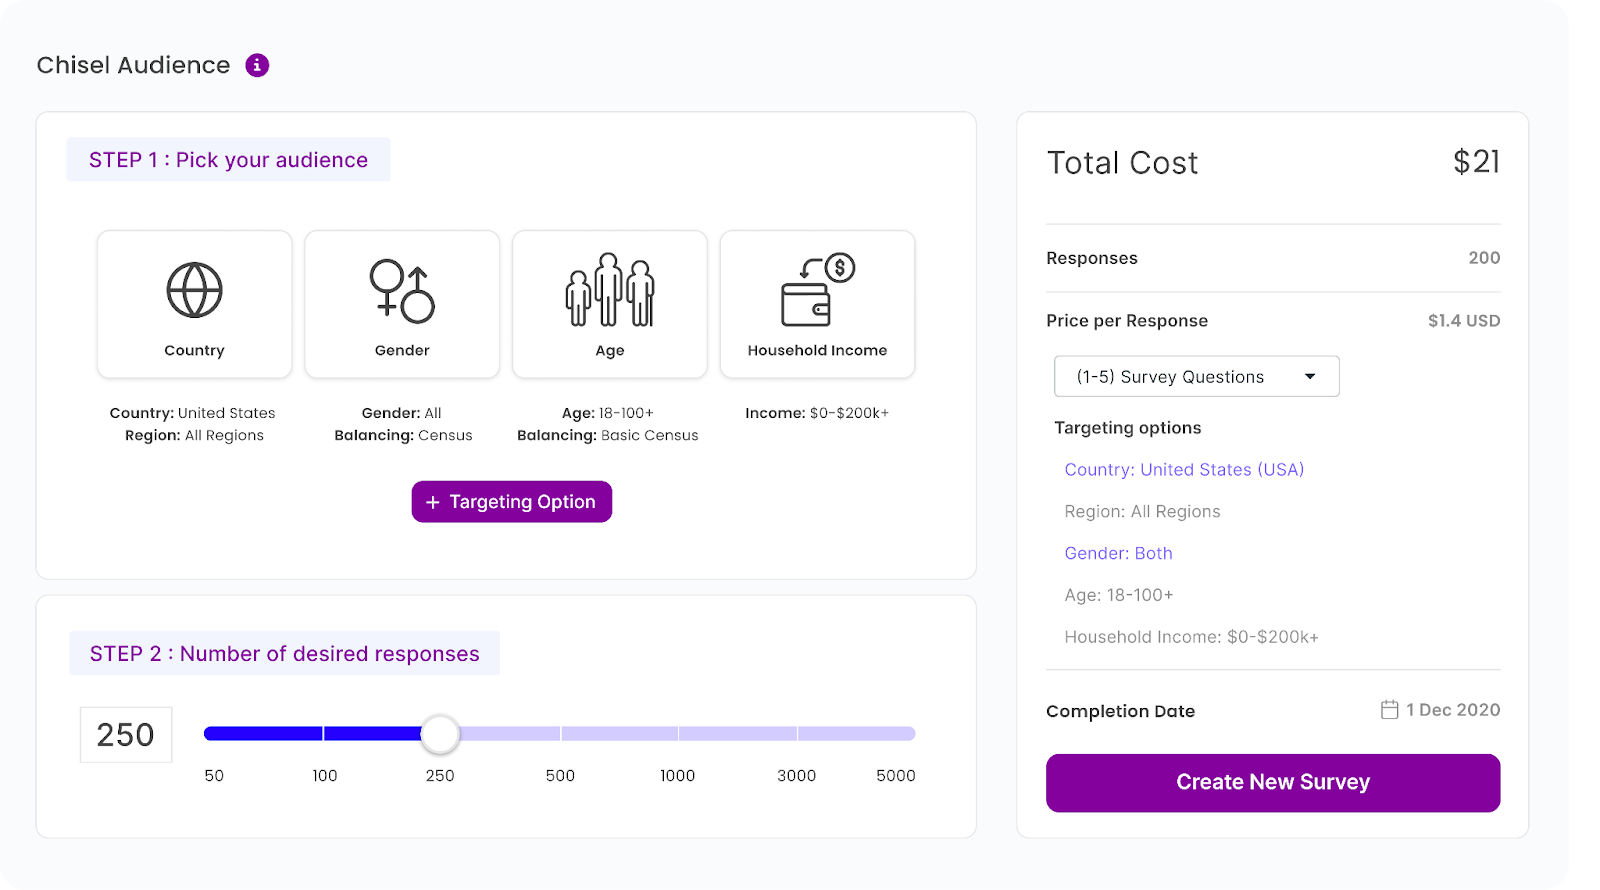
Chisel’s Audience Panel provides product managers comprehensive insights into the target audience. By segmenting the audience based on various criteria, product managers can better understand their audience’s demographics, behavior, and preferences. This information is invaluable for shaping the product’s feature set and user experience.
Step 3: Identify Key Performance Indicators (KPIs)
Did you know 95% of leading marketers agree that “to truly matter, marketing analytics KPIs must be tied to broader business goals?”
KPIs are vital for measuring the success of any product and progress towards business goals. However, selecting the proper KPIs requires careful consideration.
The best KPIs align with your overall product strategy and market objectives. They should provide measurable, actionable insights that allow for continuous improvement. You can understand user needs and pain points while tracking your progress with the right metrics.
Consider the following guidelines when selecting KPIs:
Focus on User Value: What outcomes matter most to your users? Revenue alone is incomplete. You also need to track engagement, satisfaction, and other value metrics.
Support Business Goals: Complement user metrics with those tied to your strategic goals. Revenue, growth, and efficiency KPIs clarify what success looks like for your venture.
Enable Fact-Based Decisions: Ideal KPIs inform data-driven choices. Avoid vague or immeasurable indicators that don’t guide product enhancement or problem-solving.
Essential Questions: What creates the most value? How can you quantify this? How will you apply the insights? Do the KPIs fit your goals and audience?
Regular Review & Refinement: Monitor performance over time, set targets, and re-evaluate periodically. As products evolve, so too may the most important metrics to track.
Step 4: Use the North Star Metric
The North Star indicator is the one indicator that most accurately expresses the fundamental value that your product offers to clients. Understanding what your users want and require involves understanding what they have to say. It is the metric that you should focus on improving above all else.
What makes a good North Star Metric?
A good North Star Metric is:
- Actionable: You should be able to take concrete steps to improve it.
- Predictive: It should be a leading indicator of your company’s long-term success.
- Aligned with your business goals: It should measure the value your product delivers to customers in a way that aligns with your company’s overall business goals.
How to identify your North Star Metric:
Ask yourself the following questions:
- What is the one thing my product does for customers that they cannot get anywhere else?
- How can I measure the value that my product delivers to customers in a way that aligns with my company’s business goals?
- How can I take concrete steps to improve my North Star Metric?
How to use the North Star Metric to improve your product:
Here is an example:
Imagine you are the product manager for a social media app. Your North Star Metric is DAUs (daily active users). It is because you believe that the more people who use your app daily, the more valuable it is to your business.
You track your DAUs for a few months and notice they are stagnant. You decide to interview some users to learn more about why they are not using the app more often. You find that users are bored with the content and don’t find the app very engaging.
Based on this feedback, you decide to make some changes to the app. You add new features, such as a news feed and a messaging system. You also start to curate the content more carefully and make it more relevant to users’ interests.
After making these changes, you track your DAUs again and see that they have increased by 20%. It tells you that your changes have been successful and that users are now more engaged with the app.
Step 5: Consider Leading and Lagging Indicators
Leading and lagging indicators can track the health of a product and its progress toward its goals. Leading indicators can help product managers identify areas where they need to take action to improve the product or its performance. In contrast, lagging indicators can get used to measure the success of those actions.
Here are some examples of leading and lagging indicators:
Leading indicators:
- User engagement: Metrics such as active users, daily average time on the product, and feature usage can track users’ engagement with a product.
- Customer satisfaction: Metrics such as customer satisfaction scores (CSAT) and net promoter score (NPS) can track how satisfied users are with a product.
- Product adoption: Metrics such as the number of new users and the percentage of users who have adopted new features can track how quickly users adopt a product.
Lagging indicators:
- Revenue: Revenue is a common lagging indicator for product success. It measures the amount of money that a product is generating.
- Churn rate: Churn rate is another common lagging indicator for product success. It measures the percentage of users who stop using a product over a period.
- Market share: Market share is a lagging indicator that measures the percentage of a product’s market.
Questions to ask:
When choosing leading and lagging indicators for your product, it is important to ask the following questions:
- What are the most important goals for my product?
- What actions can I take to influence those goals?
- How can I measure the progress of those actions?
- How can I use this data to make better decisions about my product?
Step 6: Avoid Vanity Metrics
In product management, focusing on metrics that truly matter and drive your product’s success is crucial, rather than being misled by vanity metrics that can create a false sense of achievement. Vanity metrics are often superficial, misleading and do not provide actionable insights. To ensure you make the right decisions, here’s how you can avoid them:
Examples of Vanity Metrics in Product Management:
- Number of Downloads: While having many downloads may seem impressive, it doesn’t necessarily indicate engagement or revenue. Ask instead, “How many of these downloads convert to active users or paying customers?
- Page Views: Many page views might make your product appear popular, but it doesn’t reveal if users find value or are dropping off. Ask, “What’s the bounce rate, and are users taking desired actions?”
- Social Media Likes and Shares: Likes and shares can inflate your ego but might not affect business success. Ask, “Do these likes result in increased conversions or sales?”
- Registered Users: A growing user base is great, but it’s a vanity metric if they’re not using your product. Ask, “How many of these registered users are actively engaging with the product?”
- Total Revenue: Total revenue can mask profitability issues. Analyze profitability by asking, “What’s our net profit margin, and are we retaining customers effectively?”
Questions to ask:
- Am I tracking any vanity metrics?
- If so, why am I tracking them?
- What real product metrics can I track instead?
- How can I use real metrics to make better decisions about my product?
Here are some additional questions you can ask to help you identify and avoid vanity metrics:
- Does this metric directly measure progress toward my product’s goals?
- Is this metric actionable? Can I use it to make decisions about how to improve my product?
- Is this metric benchmarked against other products in my market?
- Am I using this metric to compare my product to other products?
Here are some specific tips for product managers to avoid vanity metrics:
- Focus on product metrics that measure the value that your product delivers to customers. It could include metrics such as customer satisfaction, customer churn, and customer lifetime value.
- Choose actionable metrics. It means that you should be able to use the data to make decisions about how to improve your product. For example, suppose you see many customers abandoning their shopping carts. In that case, you can use this data to identify and fix the problem.
- Align your metrics with your company’s overall business goals. It will help you ensure that you track the metrics most important to your business.
By following these tips, product managers can avoid vanity metrics and choose more meaningful metrics to track. It will help them make better decisions about improving their products and achieving their business goals.
Step 7: Balance Quantitative and Qualitative Data
Quantitative data is about numbers, while qualitative data is about words and experiences. Both types of data are essential for making informed product decisions.
Quantitative data can help you to:
- Understand user behavior
- Measure the impact of changes
- Track progress over time
Qualitative data can help you to:
- Understand user needs and motivations
- Identify new opportunities
- Get feedback on your product
The best way to balance quantitative and qualitative data is to use a mixed-methods approach. It means using both types of data to answer your research questions.
Examples:
- To understand why users abandon their shopping carts, you could use quantitative data to track the abandonment rate at different stages of the checkout process. You could then use qualitative data, such as user interviews and surveys, to understand why users abandon their carts.
- To measure the impact of a new feature, you could use quantitative data to track metrics such as usage and engagement. You could then use qualitative data, such as user feedback, to understand how users use the new feature and what they think.
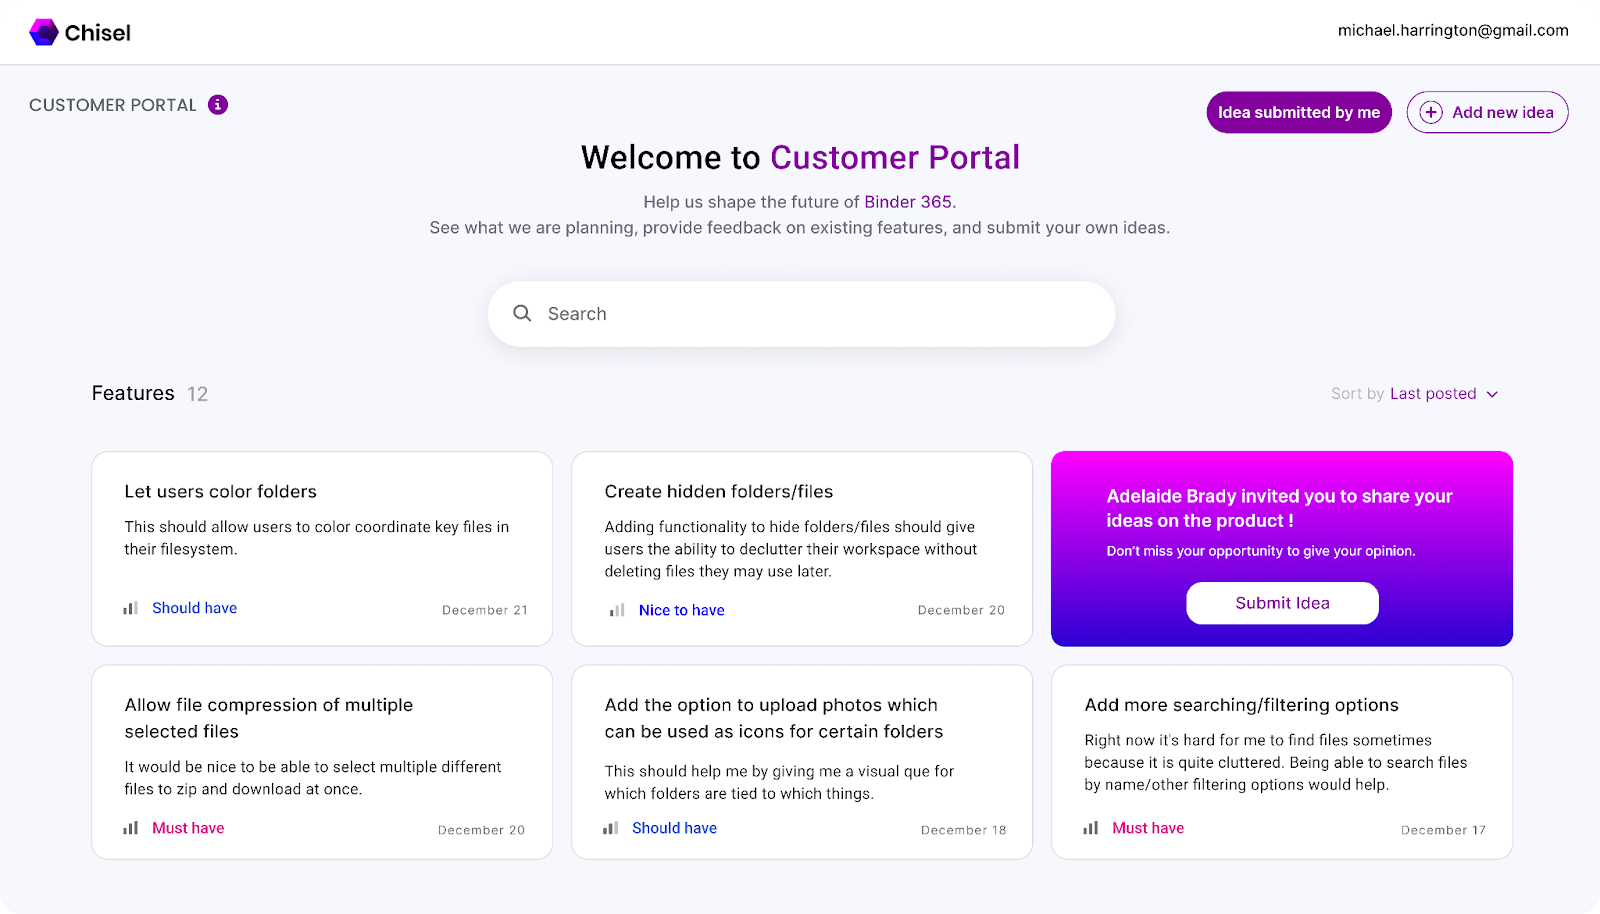
Are you looking for an incredible tool to gain insights into your customers’ feedback and their ideas for your product? Look no further than Chisel’s Feedback Portal. It empowers your customers to share their valuable ideas with you easily.
Chisel understands that customer feedback is a wellspring of innovation, so we’ve created a user-friendly portal for your customers to share, store, and prioritize their ideas, all through a simple link. It’s a seamless way to tap into your customers’ creativity and enhance your product based on their input.
Step 8: Consider Cohort Analysis
Cohort analysis helps you understand user behavior over time. It allows you to segment your users into groups based on a shared characteristic, such as the date they signed up for your product or the feature they first used. You can then track the performance of each cohort over time to identify trends and patterns.
Cohort analysis can help answer a variety of questions, such as:
- How well are new users retained?
- Which features are most popular with new users?
- How do different features impact user engagement?
- Where are users dropping out of the funnel?
Example:
Let’s say you are the product manager for a social media app. You want to understand how well your app is retaining new users. You could segment your users by the date they signed up and then track the percentage of users from each cohort who are still active 30 days later, 60 days later, and so on.
You might find that the retention rate for new users is declining over time. It could indicate a problem with your onboarding process or that your app is not engaging enough for new users.
You could use cohort analysis to investigate this issue further. For example, you could segment your users by the features they used first. You might find that users who use a specific feature first are more likely to remain active than users who don’t use that feature. This information could help you to improve your onboarding process or to develop new features that are more engaging for new users.
Step 9: Set Baselines and Benchmarks
A baseline is a starting point for measuring your product’s performance over time. A benchmark is a point of comparison for your product’s performance against other products or industry standards.
Setting baselines and benchmarks is essential because it allows you to:
- Track your product’s progress over time
- Recognize areas where your product is performing well and areas where it needs improvement
- Compare your product’s performance to other products or industry standards
Let’s say you are the product manager for an e-commerce website. You want to set a baseline for your website’s conversion rate. You could track the percentage of visitors to your website who purchase over some time, such as 30 days. It would give you a baseline conversion rate to compare future performance against.
You could also set a benchmark for your website’s conversion rate by comparing it to the conversion rates of other e-commerce websites. It would give you an idea of how your website performs relative to its competitors.
Once you have set baselines and benchmarks, you can track your product’s performance over time and identify areas where it is improving or declining. You can also use this information to compare your product’s performance to other products or industry standards.
Step 10: Iterate and Evolve
“The only thing that is constant is change.” – Heraclitus.
Product metrics are not set in stone. As your product evolves and market conditions shift, you may need to revisit and adjust your metrics.
For example, you may focus on product metrics such as user acquisition and activation when launching your product. Once you have a good user base, you may shift your focus to metrics such as engagement and retention. As your product matures, you may start to track metrics such as lifetime value and customer satisfaction.
It is also important to consider market conditions when choosing product metrics. For example, suppose your product is in a new and emerging market.
In that case, you may need to focus on metrics that measure awareness and interest. But suppose your product is in a more established market. In that case, you may focus on metrics that measure market share and customer loyalty.
Key Takeaways
Many product managers face a dilemma in selecting the right product metrics.
It’s a scenario we’re all too familiar with – you invest months of effort in developing a new product feature, only to release it to a lackluster response from users. Or perhaps you’ve seen your customer retention rates drop, but the exact reasons remain elusive. The heart of the issue lies in the metrics you choose to measure your product’s performance.
The challenge is to sift through the vast array of available metrics and determine which ones truly matter. The stakes are high because your choice of metrics will drive how you plan your product roadmap, allocate resources, and make strategic decisions moving forward. The wrong metrics can lead to wasted effort on unimportant areas while missing opportunities to enhance user satisfaction and retention.
This article provides a comprehensive solution to address these challenges. It takes you through the process of metric selection step by step, from establishing clear objectives to setting baselines and benchmarks. We have explained it all.
Challenging the status quo and digging deeper into the product metrics that matter will enable product managers to make data-driven decisions that improve product performance, user satisfaction, and overall success.